Microsoft Clarity is a user behavior analytics tool for websites that you can use. It lets you learn how users interact with your website so you can make better decisions to increase conversions. Here it captures each session that occurs on the website and generates a very comprehensive report with graphs that you can analyze. It shows you detailed insights about the devices, locations, browser used by the users. But the best part is that it offers you free session recording tool that you can use to see how a user was browsing your website at a certain period of time in the form of video simulation.
In addition to the session replays, you also get to see the heatmaps. You can view the heatmaps of clicks in desktop as well as mobile version of your website. Microsoft Clarity is a completely free tool and you can add it to multiple websites in order to see the session recordings. However, the session recording data and other statistics are not shown in real-time. The session data appears on your dashboard after 30 minutes. The session recordings and other data that it collects will stay in your project for 12 months. You can connect Google Analytics here and combine the user behavior data with the website analytics to gain more insights on the site visitors.
Microsoft Clarity Main Features:
Clarity by Microsoft is a completely free tool and anyone can use it on their websites except for financial and Government websites. All you need is a Microsoft account in order to start using it. The main components that it has on its main interface which are also its main features include:
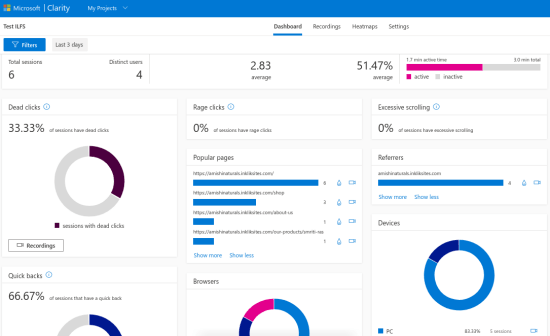
- A Comprehensive Dashboard: On the main dashboard, you can see the overall statistics of your website. Here you can see all the sessions that have occurred on your website. You can see the number of distinct users in those sessions and other statistics with an option to apply filters based on number of days. Apart from this, you can see graphical insights for popular pages, referrers, browsers, devices, countries, click rate, and operating systems.
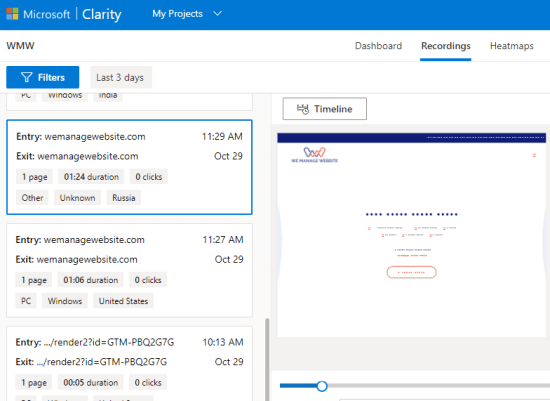
- Session Recordings: It automatically records a user session on your website. You can find all the recordings on the Recordings section in the main UI. All the recordings are sorted there by date and time. For each session recording, you can see the number of clicks captured in them with device and operating system details. Not only that but it also shows the total number of pages that were browsed in that session and its duration. In the session replay, you are given a timeline with positions of clicks marked. While watching a session, you can skip the inactivity part.
- Heat maps: Another feature of the tool to analyze the user behavior that Microsoft Clarity offers it heat maps. It shows you the area on your website with the most clicks and least clicks. The heat maps insight can help you place relevant buttons and other links on the website to increase the conversion rate. The heat map view can be changed to desktop, tablet, and mobile mode. In the later update, you will also be able to see how far the user scrolled on the page.
How to use Microsoft Clarity on your Websites?
As I have already mentioned that you need a working Microsoft account in order to get started. You can sign up for Clarity from here and you will reach the main interface where you have to create a project. A project is just a website and you just create your first project by giving it a name and URL. Do note that you need to have access to the website backend in order to set it up.
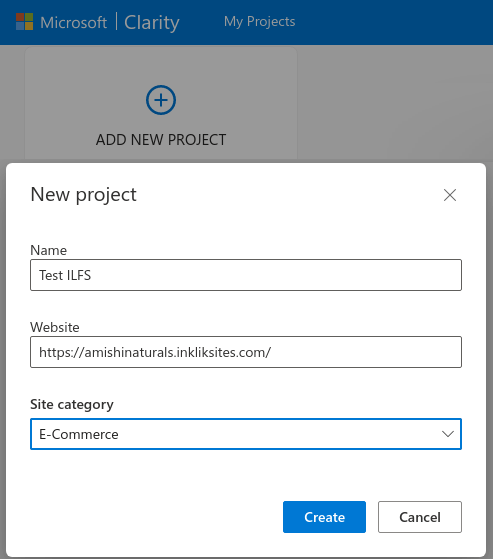
The process is very similar to installing Google Analytics tracking code. After you create a project, it will give you a JavaScript tracking code that you have to add in the <head></head> section of the website. If you are on WordPress then you can do that with the header and footer insertion plugins out there.
![]()
After you have installed the tracking code on your website, you will have to wait for a couple of hours for the insights to show up. When the script starts working, you will start seeing the data in the main dashboard. It will start showing the stats about the user devices, location and sessions. The main dashboard looks like the following.
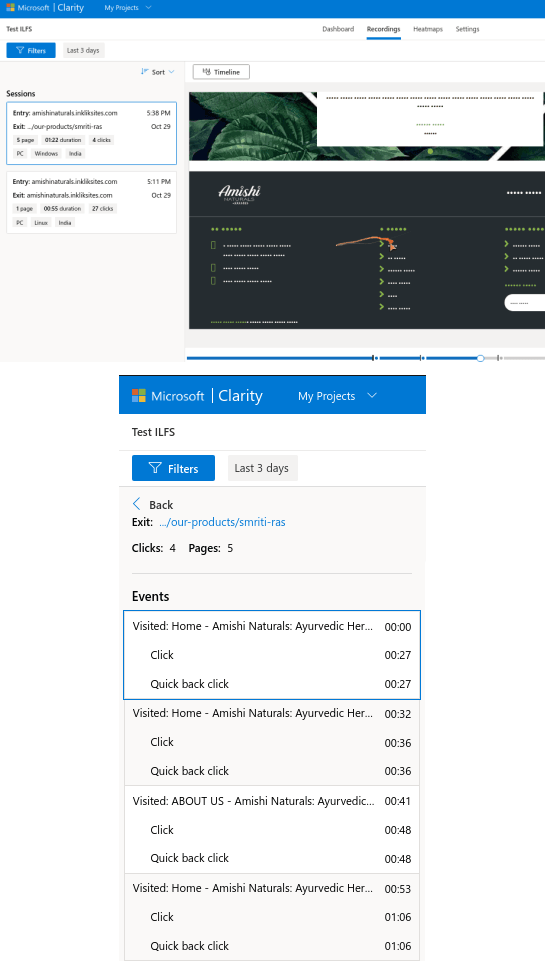
Next, you can move to the “Recordings” section. Here you will see all the user sessions that have occurred on the website since you installed the code. A session typically appears in Clarity UI after 30 minutes. All the sessions are sorted by date and newest being on the top. But you can also sort those sessions by old-new date, number of clicks, duration, and number of pages. You can play any session by just clicking on it. The session is played in a video like player on the right side and you can also see the timeline to jump to a specific event.
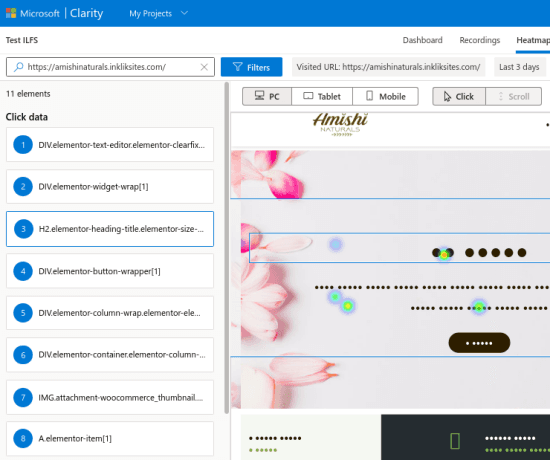
To see the heat map view of the website, simply switch to the “Heatmaps” section. Here you will see a list of all visual elements on your website on which the click events were recorded. You can see the least clicked area as well as the most clicked area. If you want then you can toggle between the desktop and mobile view as well.
In this way, you can make use of this amazing tool by Microsoft to analyze the user behavior on your site. This is simple and can greatly help you make certain decisions in order to increase overall conversions on your site. The data that it stores and records will be there for 12 months. You cannot delete data of a specific session as you will have to delete an entire project for that. The Clarity tracking code is not affected by “Do Not Track” as the script doesn’t response to browser DNT signals.
The bottom lines…
We have covered session recording and heat maps tools in the past, but they offer some kind of limitations in free tier. But this tool here by Microsoft is totally free and can record unlimited sessions. I liked the simple and uncluttered interface where you can see all the key insights about your site visitors. There is no option in it now for exporting the data but I hope in the future updates they allow session data exports.