It’s not obscure that Google tracks our location wherever we go with our smartphone with Google services installed. As per Google, it does that to make its product better for users and that seems a fair deal. Anyway, all the location data Google has on you is stored in your Google account under Google Location History. You can access it anytime you want and delete it as well.
If you used Google Maps, you might come across a feature called Your Timeline. This feature shows your daily and overall map location history. You can see all your trips on Google Maps along with the distance traveled in form of bar graphs. But this feature doesn’t show all the places recorded in the Google Location History.
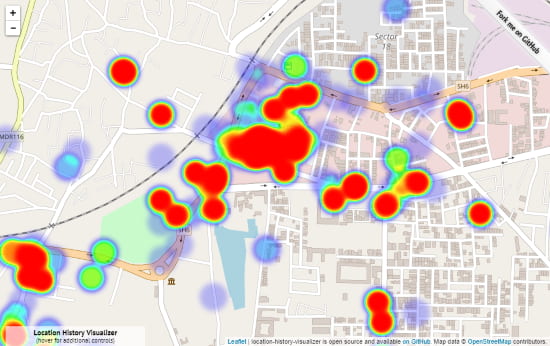
With your Google Location History data, you can view every place you have visited along with your phone. It contains the coordinates of all those places. With the free tool covered in this article, you can visualize all the Google Location History data as a heatmap.
Also read: See All the Places You Have Ever Visited as Timeline on Google Maps
How To Visualize Google Location History As Heatmap?
Location History Visualizer is a free online tool where you can upload your Google Location History data and visualize it on the map. As per the developer, this tool is designed to process the data on the device itself so, you don’t have to worry about misuse of your data. This is an open source tool with source code available on it’s GitHub page.
Unlike Google Map Timeline feature, this tool is overlaid over time location data. This way, you can easily see which places you visited more frequently and which ones you visited rarely. Visualizing your location history with this tool is a two-step process. First, you have to download your location data from Google. Then, you can upload it to this tool and visualize it as heatmap on an interactive map.
Step 1: Get Your Google Location History Data
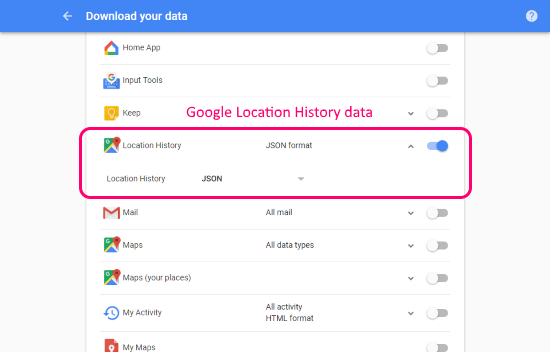
To get your Google Location History data, visit Google Takeout page and log in with your Google credentials. From this page, you can download your Google account data from all the Google products. For this tool, we only need Location History data, so uncheck all the other products except Location History. Click on Location History and make sure the data format is JSON. After that, go to the end of the page and click Next.

On the next page, Google creates an archive of your data and asks you to select a format and size for the archive. Select ZIP format for the archive and leave the size as it is. Then, click Create Archive button and download your data archive from the next page.
Step 2: Visualize the data as Heatmap
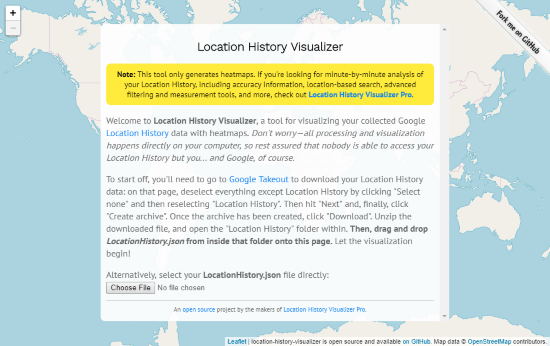
Once you get your location history data the rest of the process is easy. Simply unzip the downloaded ZIP file to get the LocationHistory.json file. Then, visit the Location History Visualizer website and upload the JSON file there. Depending on your file size, it takes a few minutes to process your data.

Upon processing, this tool plots all your location data on the map creating a heatmap of all the places you have visited. You can navigate the map by clicking and dragging, and zoom by scroll or with the given button.

Visualize your Google Location History as Heatmap here.
Wrap Up:
With Location History Visualizer, you can easily visualize all your Google Location History data on an interactive map. After plotting the data, you can navigate the map to have a closer look at all the locations you have ever visited. It is a nice tool to see all the places you have been to, some of which might gonna bring some memories.