This article explains how to display performance metrics in HUD on Chrome. Google Chrome frequently gets updated with new features that you can access through flags. The latest addition to that is a feature that shows Heads Up Display on the screen showing various performance measuring scores of any website you visit.
This new feature is basically for developers who often have to track the performance of websites. The HUD shows metrics that are part of Google’s Core Web Vitals platform including First Input Delay (FID), Largest Contentful Paint (LCP), Cumulative Layout Shift (CLS), framerate, etc. If you like to give this feature a try here is how you can enable it.
Also read: Control Music Playback from Any Tab of the Browser with This Free Extension
How to Display Performance Metrics in HUD on Chrome?
This new website performance metrics HUD feature is currently available in the Canary builds of Google Chrome which is a build for testing new features before it gets public. So, to be able to get this feature, you have to install the latest version of Chrome Canary on your PC. The platform doesn’t matter here, the feature will work across all desktop platforms including Windows, macOS, and Linux.
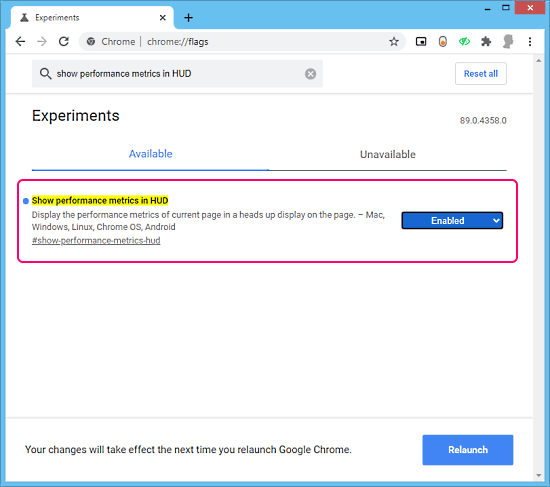
To enable this feature, open Chrome Canary and paste the following link to in the address bar:
chrome://flags
This takes you to the flags page of Chrome where you can access and configure flag features. Type “Show performance metrics in HUD” in the search bar here and hit enter to get the results. You get a flag named Show performance metrics in HUD. Simply change its value to Enabled from Default. Doing this prompts you to restart your browser. Just do that to get the feature working.
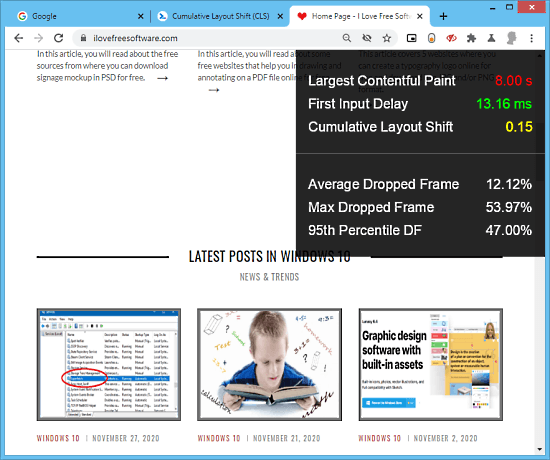
Once enabled, you get a HUD on every website you visit. It tracks the performance of that website and instantly shows you the following information:
- Largest Contentful Paint
- First Input Delay
- Cumulative Layout Shift
- Average Dropped Frame
- Max Dropped Frame
- 95th Percentile DF
This gives you some of the key information about a website right away and you don’t have to switch through tabs or use other tools to get the same.
Closing Words
This new feature can be handy for developers who have to take care of the performance metrics of websites. It shows you that right away on that particular website with no extra step needed. Currently, this feature is exclusive to Chrome Canary but you can get the same on a regular build of Google Chrome using this free Chrome extension.